
Bitcoin's dominance over the total crypto market cap has declined significantly, from 63.8% last week to around 60.8% as of Friday, while the total market cap reached $4 trillion. At the same time, major altcoins like Ethereum and XRP recorded sharp price gains: Ethereum rose approximately 24% to $3,740, and XRP surged 20.48% to $3.47 — hitting a new all-time high.
This trend has reignited discussions around a potential “altcoin season”, a period when non-Bitcoin assets outperform in the broader crypto market. However, according to Adrian Fritz, Head of Research at 21Shares, the drop in Bitcoin dominance alone isn’t sufficient to confirm a structural shift. Fritz explained that while this could be an early signal of an altcoin rally, other indicators such as capital inflows, trading volume, and investor sentiment must also align.
So far, Bitcoin still holds its ground as the flagship crypto asset, especially after the launch of Bitcoin spot ETFs earlier this year, which opened the door for institutional investors to gain exposure to crypto without holding the asset directly. These ETFs have fueled Bitcoin’s dominance throughout 2024 and 2025, acting as the gateway for many large players entering the digital asset space.
Looking forward, if the altcoin rally gains traction, we could witness a shift in capital flows toward assets like Ethereum, XRP, Solana, and others. Additionally, the potential for interest rate cuts by the Federal Reserve in the second half of the year could inject liquidity into the market, strengthening the altcoin narrative. Still, investors must remain cautious: volatility remains high, and regulatory uncertainty in the U.S. and other major markets could disrupt momentum.
Notably, the CoinMarketCap “Altcoin Season Index” currently stands at 52, now favoring Altcoin, as the index needs to hit 100 to signal a full-fledged altcoin season. This suggests we’re on the verge of a shift, but the market has entered altcoin territory.
BTC Technical Analysis
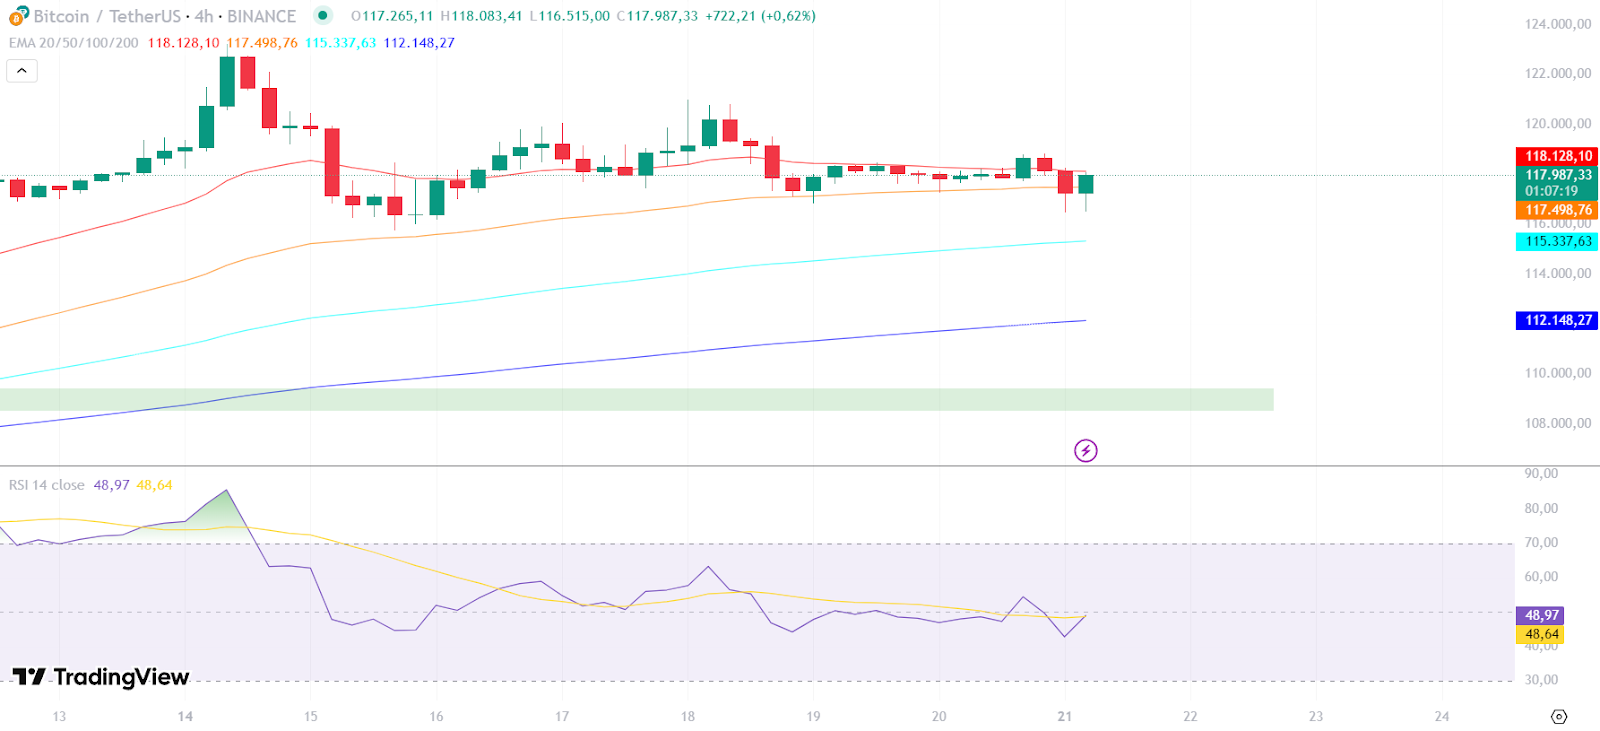
Bitcoin is currently trading around $117,987.33, showing a gain of +0.62% from its opening. This indicates a slight increase as the previous close was $117,265.11. The price is still consolidating after a significant move, as evidenced by the relatively flat movement on the chart between July 17th and 21st, holding above the $117,000 level.
The price is trading above the 20 EMA, 50 EMA, and 200 EMA. While the price is slightly below the 20 EMA, it remains well supported by the 50 EMA and significantly above the 200 EMA, which is a bullish signal. The EMAs are showing signs of flattening out, indicating the current consolidation phase.
On the RSI (14), Bitcoin is at 48.97, which is a significant change. The current RSI value suggests that Bitcoin is in a more neutral territory, neither overbought nor oversold. The RSI has pulled back from higher levels, indicating a cooling off of buying pressure and a potential for consolidation or a minor correction within the broader trend. Traders should observe if the RSI can find support around the 50 level for a continuation of an upward trend, or if it breaks lower, signaling increased bearish momentum.
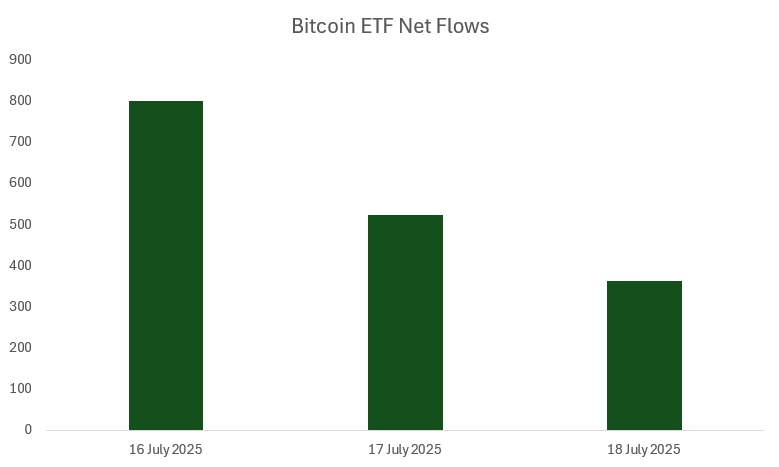
The Bitcoin ETF net flow chart from July 16 to July 18, 2025, continued to reflect strong institutional interest, with significant inflows of $799.4 million on July 16, $522.6 million on July 17, and $363.5 million on July 18. This steady capital injection has played a key role in supporting Bitcoin’s price resilience and sets the stage for potential upside in the near term.
ETH Technical Analysis
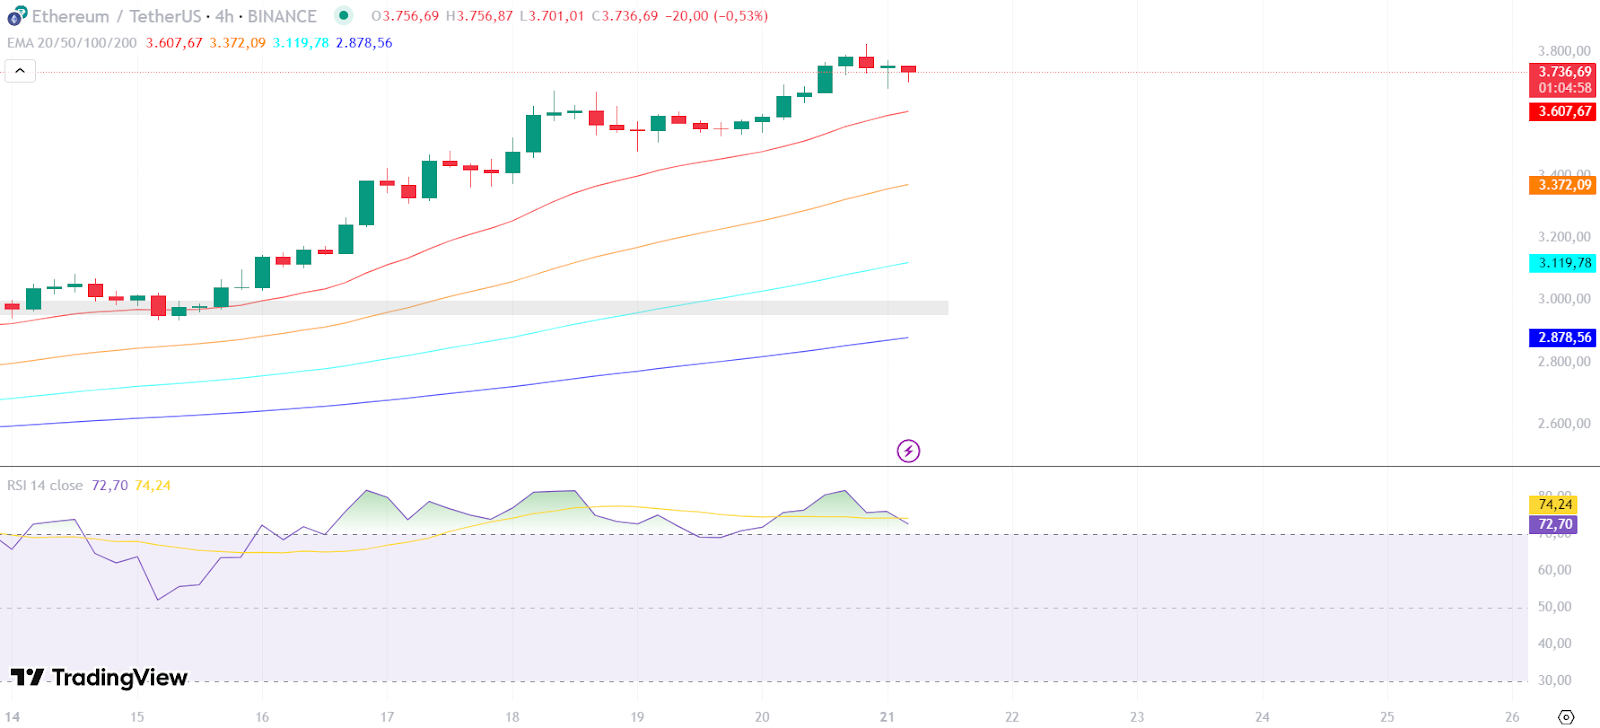
Ethereum is currently trading around $3,736.69, a major increase of 24% from last week. ETH has maintained its strong bullish momentum from previous days, evidenced by its significant gains over the last few days as seen on the chart.
The price structure remains highly constructive, with ETH trading well above all key EMAs. It is currently positioned above the 20 EMA, the 50 EMA, and the 200 EMA. This clear layered alignment of the EMAs confirms a robust uptrend across short, medium, and long timeframes, indicating strong buying pressure and support.
On the momentum side, the RSI (14) is currently at 72.70. This indicates that Ethereum is in overbought territory, reflecting strong buying interest and momentum. While this suggests significant demand, traders should continue to monitor for signs of potential short-term pullbacks or consolidation, as extended periods in overbought conditions can sometimes precede a temporary correction.
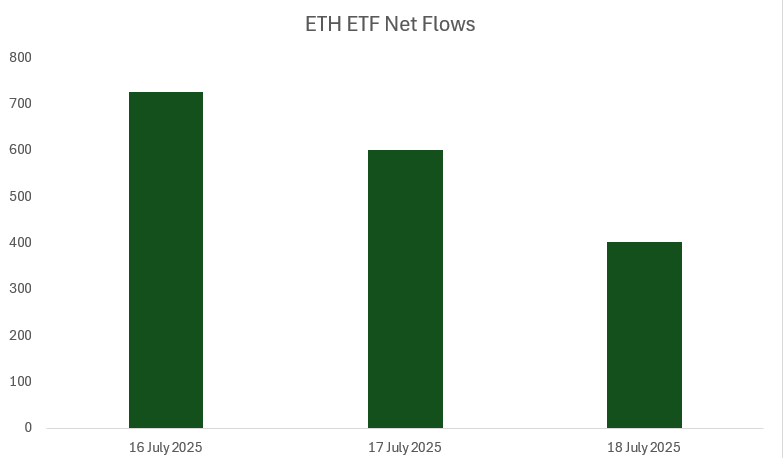
The Ethereum (ETH) ETF net flow chart from July 16 to July 18, 2025, continued to reflect strong institutional interest, with significant inflows of $726.6 million on July 16, $602 million on July 17, and $402.5 million on July 18. This steady capital injection has played a key role in supporting Ethereum’s price resilience and sets the stage for potential upside in the near term.
SOL Technical Analysis
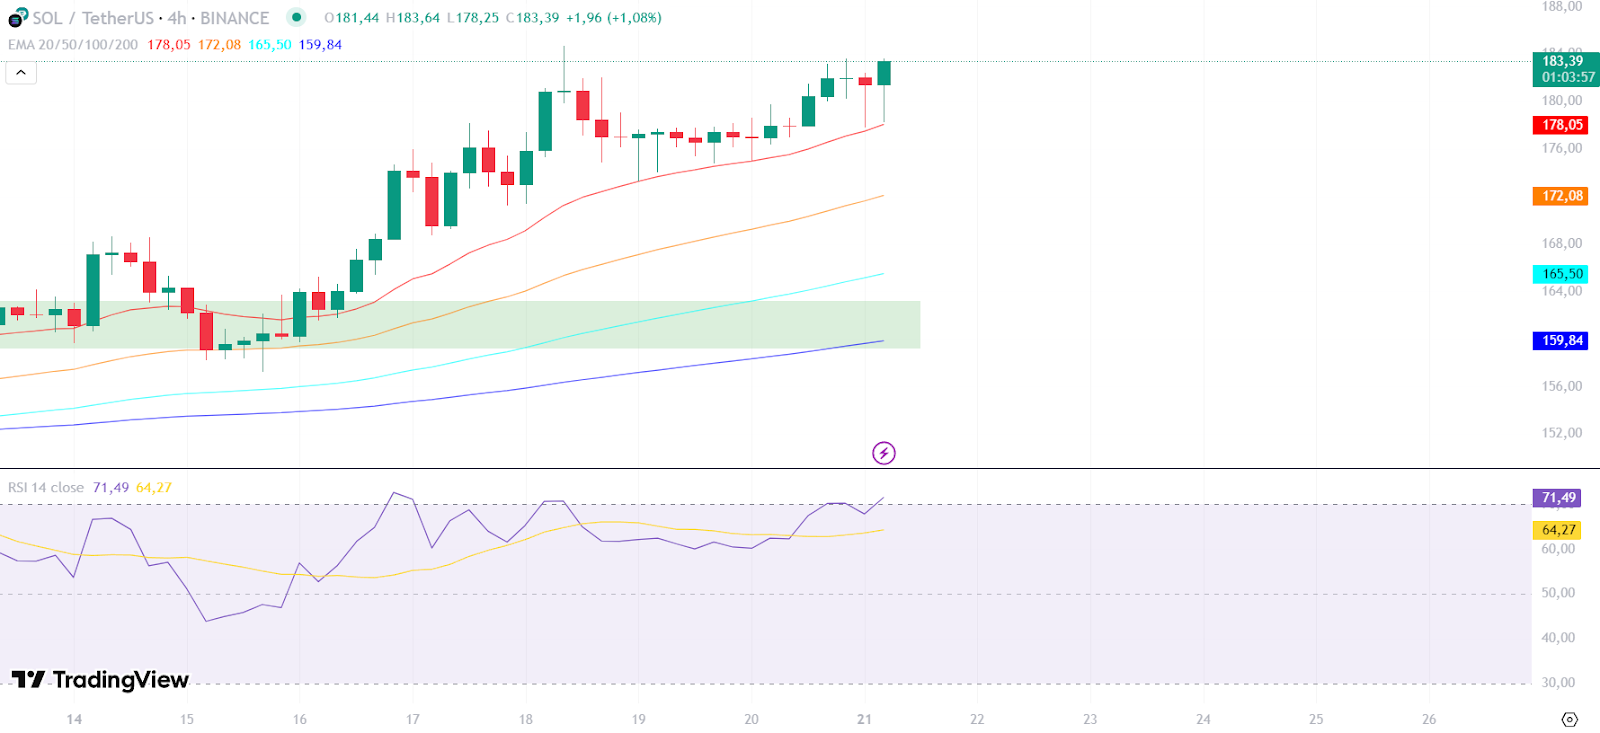
Solana has continued its strong bullish momentum, currently trading at $183.39, showing a gain of +11.6% this week. The chart displays a clear upward trend, with SOL now trading significantly higher than the previous consolidation zone and challenging new highs.
Price is now well above all key Exponential Moving Averages (EMAs). The 20 EMA is at $178.05, acting as strong immediate dynamic support. Solana is also trading comfortably above the 50 EMA, the 100 EMA, and the 200 EMA. This layered alignment of EMAs, all pointing upwards, confirms a robust uptrend across short, medium, and long timeframes, indicating sustained bullish sentiment.
The RSI (14) has further risen to 71.49. This indicates that Solana has moved into overbought territory, reflecting strong buying pressure and momentum. While this signifies significant demand, traders should be mindful of potential short-term pullbacks or consolidation, as extended periods in overbought conditions can sometimes precede a temporary correction. However, the overall trend remains strongly bullish as long as price maintains above the key EMA levels.
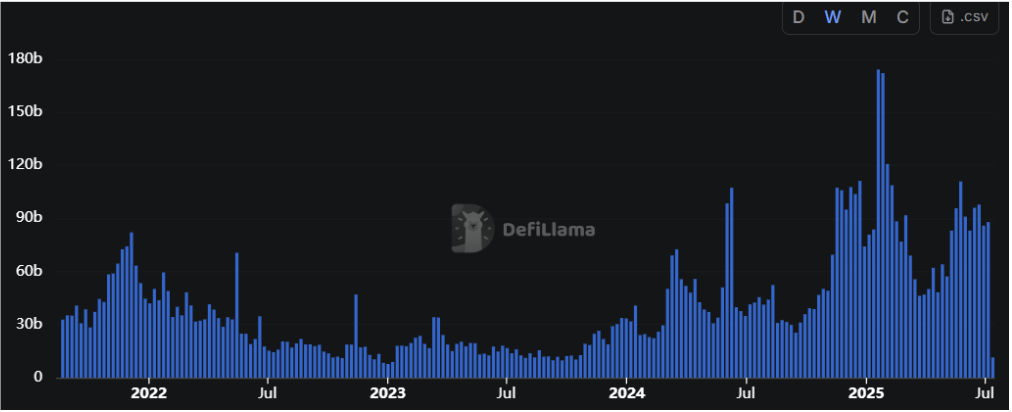
The latest data shows that DEX trading volume has decreased compared to its peak in late 2024. Although still higher than 2023 levels, the recent downtrend suggests cooling market activity and reduced trading momentum in the decentralized space.