
A renewed U.S. policy push under the Trump administration is intensifying global interest in stablecoins, prompting Asian financial centers to fast-track regulation. As Washington aligns its legislative agenda behind dollar-pegged digital assets, regions like South Korea, Hong Kong, and China are racing to respond—each navigating the balance between innovation and monetary sovereignty.
South Korea saw nearly $41 billion in stablecoin transactions last quarter, mostly in USD-pegged assets. Lawmakers are pushing to introduce won-backed tokens, but central bank officials remain cautious, citing risks to capital control and monetary stability. In contrast, Hong Kong is embracing regulation, launching a licensing regime for stablecoin issuers in August. Major Chinese firms like JD.com and Ant Group are preparing to issue HKD- and yuan-pegged stablecoins offshore.
Investor enthusiasm has followed. Over $1.5 billion was raised by Asia-based fintechs in July alone, and a new stablecoin equity index is up 65% YTD, far outpacing broader market benchmarks. Even mainland China, despite its crypto ban, is quietly evaluating offshore yuan stablecoins through special trade zones and sandbox programs.
What does this mean for stablecoins? The global stablecoin race is no longer just about dollar dominance. It’s about control, liquidity, and regional influence. As Asia rolls out local alternatives, expect a more fragmented but competitive stablecoin market, where sovereign-backed tokens could challenge USD-denominated tokens in cross-border trade, foreign exchange efficiency, and regulatory alignment. The next phase of stablecoin adoption may be shaped less by tech—and more by geopolitics and financial sovereignty.
BTC Technical Analysis
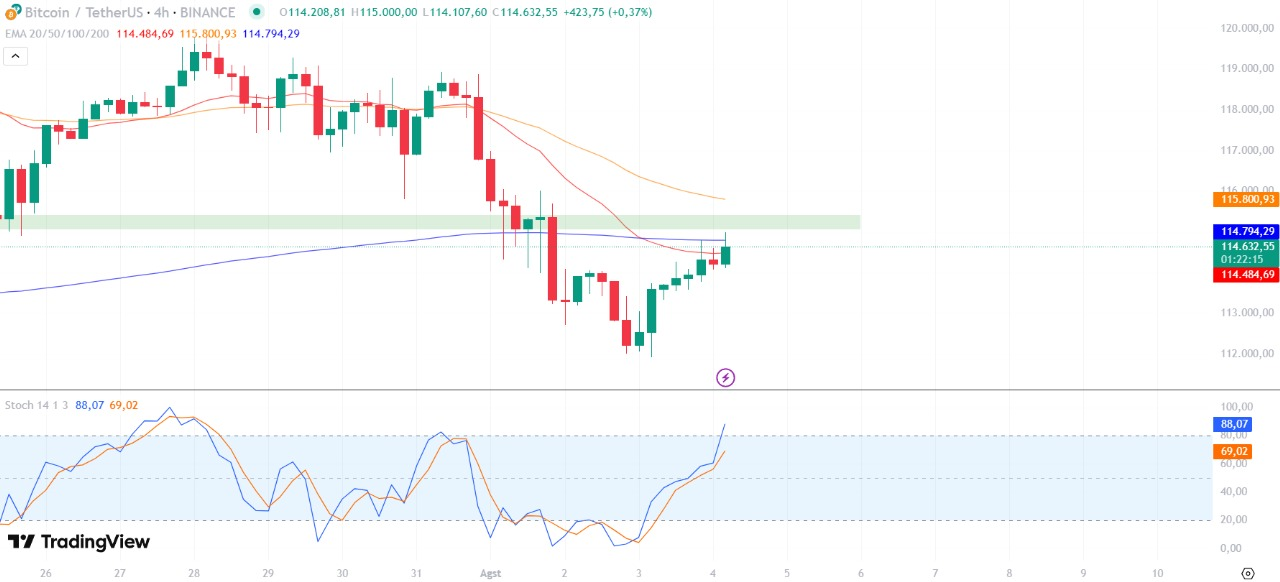
Bitcoin is currently trading around $114,632, showing a mild +0.37% gain in the last 4 hours after a clean short-term rebound from recent lows. The move marks a test of a key resistance zone between $114,600 and $115,800, an area previously acting as both support and rejection.
Price is now testing the 200 EMA, while pushing above the 20 EMA and 50 EMA, signaling a shift in short-term momentum. A confirmed break and close above the resistance cluster and 200 EMA could pave the way toward higher levels, potentially retesting $117,000 and beyond.
The Stochastic RSI shows the blue line at 88.07, indicating that BTC is entering overbought territory. While this suggests strong bullish momentum, it also warns of possible short-term exhaustion, especially if the price fails to close above resistance convincingly. Traders should watch for either a clean breakout above $115,800 or a rejection that could trigger a retest of the $113,000 zone.
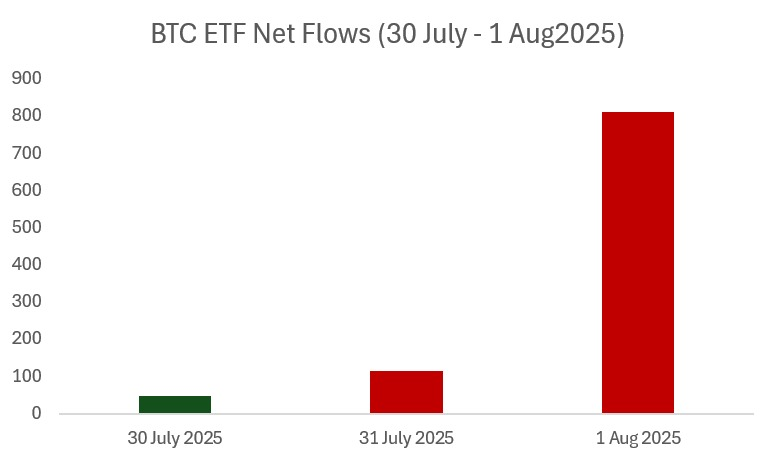
The Bitcoin ETF net flow chart from July 30 to August 1, 2025, signaled a sharp shift in institutional sentiment. After an inflow of $47.1 million on July 30, the tide turned with net outflows of $114.8 million on July 31 and a significant $812.3 million withdrawal on August 1. This rapid reversal may explain the recent loss in bullish momentum. If outflows persist, Bitcoin could face heightened volatility and deeper corrections in the near term.
ETH Technical Analysis
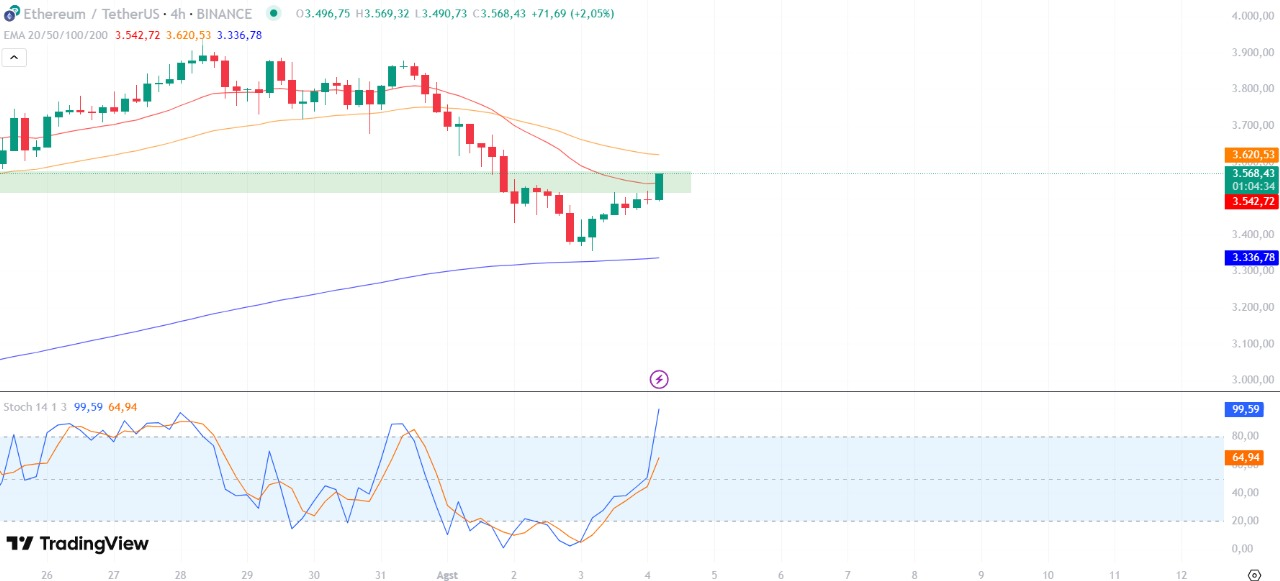
Ethereum has extended its recovery, currently trading at $3,568, up +2.05% in the last 4 hours. After finding support around $3,360, ETH broke above the previous supply zone and reclaimed the 20 EMA, showing renewed short-term bullish momentum.
Price is approaching the 50 EMA, which may act as immediate resistance. A clean breakout above this level could open the path toward $3,700+. The 200 EMA remains well below at $3,336, reinforcing the bullish structure's medium-term validity.
Momentum-wise, Stochastic RSI is deep in overbought territory at 99.59, suggesting ETH may face short-term cooling or consolidation. Traders should monitor for possible rejections or bearish divergence, especially near the 50 EMA.
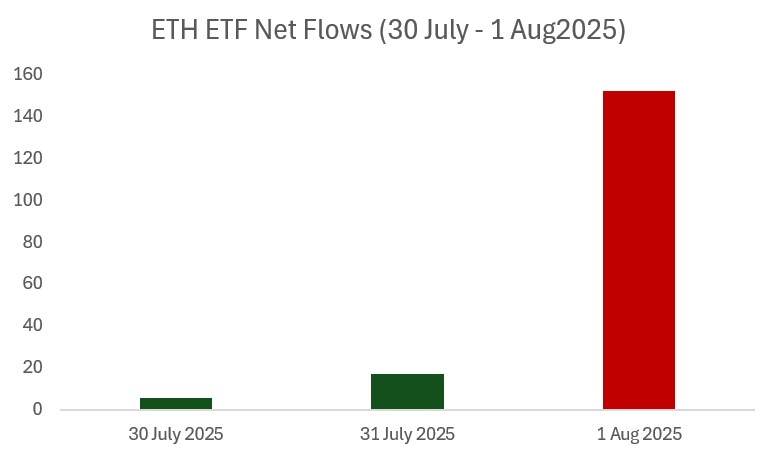
The ETH ETF net flow chart from July 30 to August 1, 2025, showed a mixed picture of investor sentiment. Modest inflows were recorded on July 30 ($5.8 million) and July 31 ($17 million), indicating continued accumulation. However, this trend reversed sharply on August 1, with a notable outflow of $152.3 million, signaling potential profit-taking or short-term risk-off behavior. This sudden shift could weigh on ETH’s price momentum if selling pressure persists.
SOL Technical Analysis
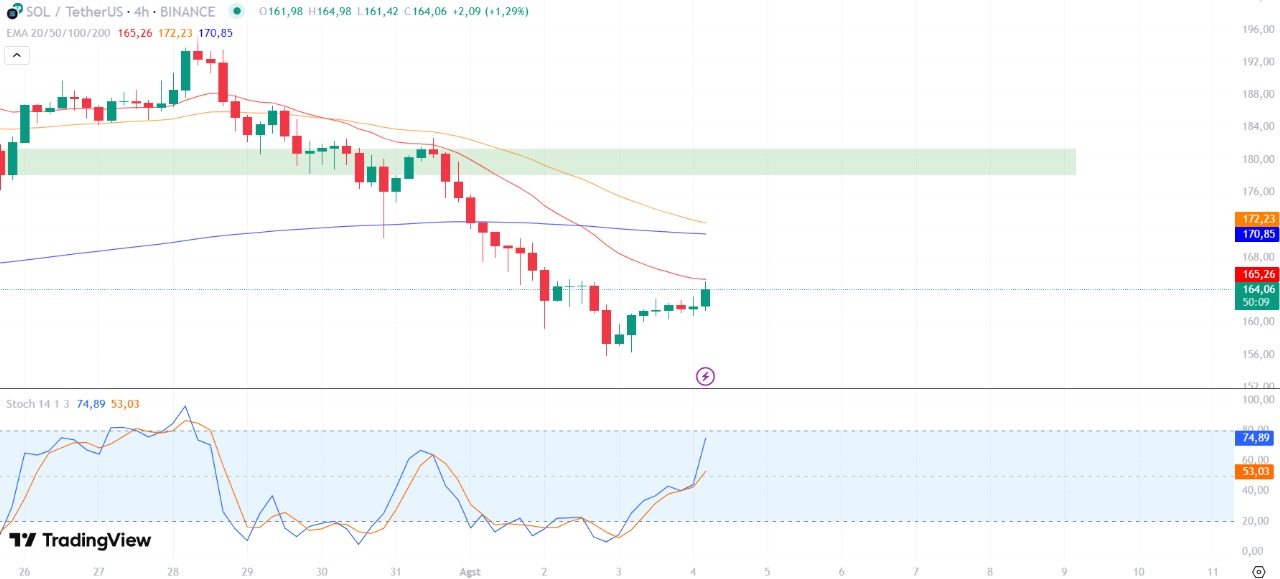
Solana continues its recovery, currently trading at $164.06, up +1.29% in the last 4 hours. After finding support near $152, SOL has pushed higher, reclaiming the 20 EMA , a critical short-term level, indicating early signs of bullish momentum.
The price is now approaching a confluence of resistance: the 50 EMA and the 100 EMA. A confirmed breakout above this zone could validate a short-term trend reversal and open up a path toward the $178–$180 region. Failure to break above could lead to a pullback toward $161 or even $156.
Stochastic RSI is climbing, now at 74.89, showing increasing bullish momentum but traders should monitor for overextension or a possible bearish crossover in the short term.
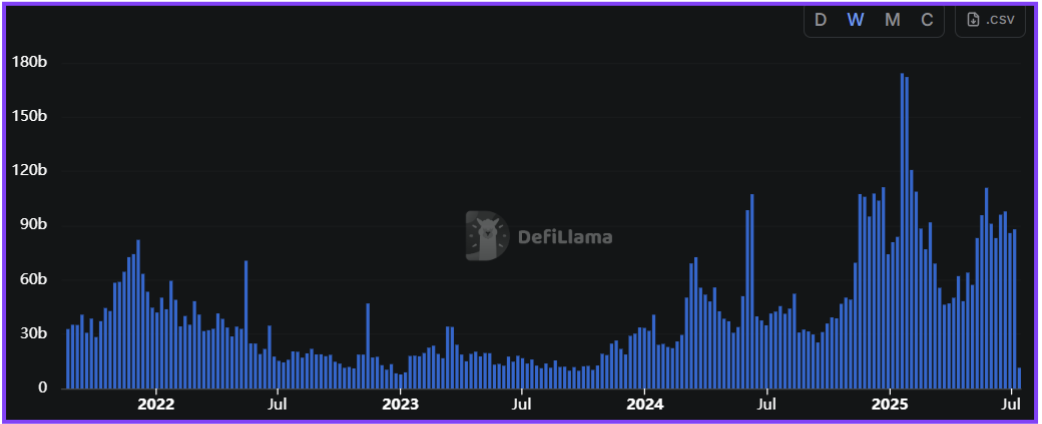
The latest data shows that DEX trading volume has decreased compared to its peak in late 2024. Although still higher than 2023 levels, the recent downtrend suggests cooling market activity and reduced trading momentum in the decentralized space.